Intentional Firearm Homicide by Race in the Southeastern US
A project collaborated with Abigail Ruths at Emory University Fall 2019.
Mortality data were obtained from CDC Wonder by race (Black & African American, White) in all available years (1999-2017). ICD-10 codes X95, X94, and X95 were selected, representing intentional homicide by handgun, rifle, shotgun, larger firearm, airgun, BB gun, flare gun, and other and unspecified firearm. Firearm discharges of undetermined intention and suicides were not included. Counties were limited to the Southeastern region of the United States (16 states and Washington, D.C.) due to author interest and high concentration of Black and African American people.
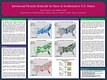
The maps show the total populations, the crude rates of homicides in each population, and the rate ratio between the two rates.
We examined and reported the top five counties for the Black crude mortality rate, the White crude mortality rate, and the mortality rate ratio. We used the 2013 NCHS Urban-Rural Classification Scheme (4) to label the counties with six urban-rural categories: large central metro, large fringe metro, medium metro, small metro, micropolitan, and noncore.
The crude rate for Black gun homicides was spatially heterogeneous and largely concentrated in areas of high Black population. The top five counties with the highest Black gun homicide rates were all urban. There were also three areas of clusters that we found most interesting: the Mississippi River Valley, southern Alabama, and southeastern South Carolina. These three cluster areas curiously mirror three areas of high slave concentration in 1860 (5), an observation that warrants additional exploration.
The crude rate for White gun homicides was also spatially heterogeneous with less obvious rural-urban distinction. We did notice three cluster areas that we knew to be rural: Appalachia, southeastern North Carolina, and eastern Oklahoma. With this in mind, we explored the urban-rural categories of the top five white gun homicide rates and found that four of the five were rural.
The Black-to-White gun homicide rate ratio was greater than 1.0 in all but one county (Hale County, AL). The highest disparity was in Washington, D.C., where Black individuals faced 19.52 times the risk of gun homicide as White individuals. The five counties with the highest rate ratios were metropolitan.
There are several possible next steps for these findings. Gun violence surveillance should be expanded and prioritized to improve data collection and further analysis. The heterogeneity of the findings across and between both populations prompt further investigation into measuring the relationship of gun homicide and factors including education, poverty, slavery legacy, mental health, and perpetrator characteristics.
Clearly the solutions to addressing gun violence are complex and a one size fits all approach isn't sufficient.

")
")
")
")
")
A project collaborated with Abigail Ruths at Emory University Fall 2019.
Mortality data were obtained from CDC Wonder by race (Black & African American, White) in all available years (1999-2017). ICD-10 codes X95, X94, and X95 were selected, representing intentional homicide by handgun, rifle, shotgun, larger firearm, airgun, BB gun, flare gun, and other and unspecified firearm. Firearm discharges of undetermined intention and suicides were not included. Counties were limited to the Southeastern region of the United States (16 states and Washington, D.C.) due to author interest and high concentration of Black and African American people.
The maps show the total populations, the crude rates of homicides in each population, and the rate ratio between the two rates.
We examined and reported the top five counties for the Black crude mortality rate, the White crude mortality rate, and the mortality rate ratio. We used the 2013 NCHS Urban-Rural Classification Scheme (4) to label the counties with six urban-rural categories: large central metro, large fringe metro, medium metro, small metro, micropolitan, and noncore.
The crude rate for Black gun homicides was spatially heterogeneous and largely concentrated in areas of high Black population. The top five counties with the highest Black gun homicide rates were all urban. There were also three areas of clusters that we found most interesting: the Mississippi River Valley, southern Alabama, and southeastern South Carolina. These three cluster areas curiously mirror three areas of high slave concentration in 1860 (5), an observation that warrants additional exploration.
The crude rate for White gun homicides was also spatially heterogeneous with less obvious rural-urban distinction. We did notice three cluster areas that we knew to be rural: Appalachia, southeastern North Carolina, and eastern Oklahoma. With this in mind, we explored the urban-rural categories of the top five white gun homicide rates and found that four of the five were rural.
The Black-to-White gun homicide rate ratio was greater than 1.0 in all but one county (Hale County, AL). The highest disparity was in Washington, D.C., where Black individuals faced 19.52 times the risk of gun homicide as White individuals. The five counties with the highest rate ratios were metropolitan.
There are several possible next steps for these findings. Gun violence surveillance should be expanded and prioritized to improve data collection and further analysis. The heterogeneity of the findings across and between both populations prompt further investigation into measuring the relationship of gun homicide and factors including education, poverty, slavery legacy, mental health, and perpetrator characteristics.
Clearly the solutions to addressing gun violence are complex and a one size fits all approach isn't sufficient.