The following displays the crude death rate (per 100,000 persons) by US state with box-plots for each state organized relative to their geographic location. The box-plots depict the distributions of each state including minimum, 25th percentile, median, 75th percentile, and the maximum.

")
")
")
")
")
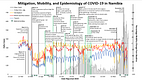

The following displays the crude death rate (per 100,000 persons) by US state with box-plots for each state organized relative to their geographic location. The box-plots depict the distributions of each state including minimum, 25th percentile, median, 75th percentile, and the maximum.